Nissan AMIEO DEI Annual Report FY2023

Our DEI strategic pillars

% Executive Vice President level by Gender
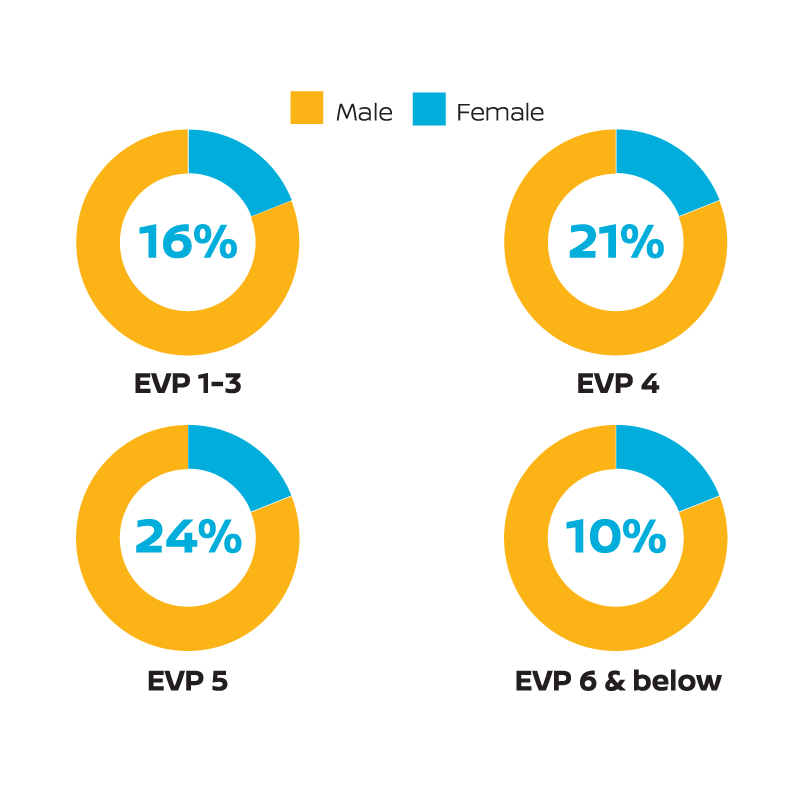
These diagrams show the percentage of Executive Vice President level by Gender. EVP 1 to 3. Male: 84%. Female: 16%. EVP 4. Male: 79%. Female: 21%. EVP 5. Male: 76%. Female: 24%. EVP 6 & below. Male: 90%. Female: 10%.

Key Points:

  • % of females at EVP 1-3 and EVP-5 level increased by 2% from FY2022
% Executive Vice President level by Generation
These diagrams show the percentage of Executive Vice President level by Generation. EVP 1 to 3. Baby Boomer: 6%. Gen X: 77%. Millennial: 17%. EVP 4. Baby Boomer: 4%. Gen X: 56%. Millennial: 40%. EVP 5. Baby Boomer: 5%. Gen X: 41%. Millennial: 54%. EVP 6 & below. Baby Boomer: 3%. Gen X: 24%. Millennial: 54%. Gen Z: 3%. NA: 1%.

Key Points:

  • 17% of Executives EVP 1-3 and 40% of Managers EVP-4 are millennials
  • Balanced mix of age demographics across EVP-4 & EVP-5 populations
% Executive Vice President level by Location
These diagrams show the percentage of Executive Vice President level by location. EVP 1 to 3. Africa: 5%. Middle East: 8%. India: 4%. Europe: 80%. Oceania: 3%. EVP 4. Africa: 5%. Middle East: 9%. India: 6%. Europe: 77%. Oceania: 3%. EVP 5. Africa: 4%. Middle East: 6%. India: 9%. Europe: 76%. Oceania: 5%. EVP 6 & below. Africa: 10%. Middle East: 1%. India: 31%. Europe: 56%. Oceania: 2%.

Key Points:

  • Most Executives are based out of the NAE or NMEF offices
  • EVP-6 & below with highest diversity due to large amount of manufacturing staff in plants, 41% of employees in India & Africa